The documentation you are viewing is for Dapr v1.9 which is an older version of Dapr. For up-to-date documentation, see the latest version.
Using OpenTelemetry Collector to collect traces to send to AppInsights
Dapr integrates with OpenTelemetry Collector using the Zipkin API. This guide walks through an example using Dapr to push trace events to Azure Application Insights, using the OpenTelemetry Collector.
Requirements
A installation of Dapr on Kubernetes.
How to configure distributed tracing with Application Insights
Setup Application Insights
- First, you’ll need an Azure account. See instructions here to apply for a free Azure account.
- Follow instructions here to create a new Application Insights resource.
- Get the Application Insights Intrumentation key from your Application Insights page.
Run OpenTelemetry Collector to push to your Application Insights instance
Install the OpenTelemetry Collector to your Kubernetes cluster to push events to your Application Insights instance
-
Check out the file open-telemetry-collector-appinsights.yaml and replace the
<INSTRUMENTATION-KEY>placeholder with your Application Insights Instrumentation Key. -
Apply the configuration with
kubectl apply -f open-telemetry-collector-appinsights.yaml.
Next, set up both a Dapr configuration file to turn on tracing and deploy a tracing exporter component that uses the OpenTelemetry Collector.
-
Create a collector-config.yaml file with this content
-
Apply the configuration with
kubectl apply -f collector-config.yaml.
Deploy your app with tracing
When running in Kubernetes mode, apply the appconfig configuration by adding a dapr.io/config annotation to the container that you want to participate in the distributed tracing, as shown in the following example:
apiVersion: apps/v1
kind: Deployment
metadata:
  ...
spec:
  ...
  template:
    metadata:
      ...
      annotations:
        dapr.io/enabled: "true"
        dapr.io/app-id: "MyApp"
        dapr.io/app-port: "8080"
        dapr.io/config: "appconfig"
Some of the quickstarts such as distributed calculator already configure these settings, so if you are using those no additional settings are needed.
That’s it! There’s no need include any SDKs or instrument your application code. Dapr automatically handles the distributed tracing for you.
NOTE: You can register multiple tracing exporters at the same time, and the tracing logs are forwarded to all registered exporters.
Deploy and run some applications. After a few minutes, you should see tracing logs appearing in your Application Insights resource. You can also use the Application Map to examine the topology of your services, as shown below:
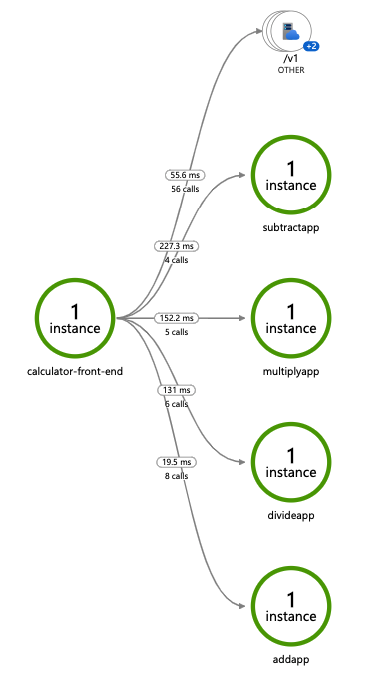
NOTE: Only operations going through Dapr API exposed by Dapr sidecar (e.g. service invocation or event publishing) are displayed in Application Map topology.
Related links
- Try out the observability quickstart
- How to set tracing configuration options
Feedback
Was this page helpful?
Glad to hear it! Please tell us how we can improve.
Sorry to hear that. Please tell us how we can improve.